The past decade has marked the rapid emergence of a number of firms from developing countries as significant players in global markets. The 2012 Fortune Global 500 list features 112 developing economy companies, an increase of about six times since 2000. While this list is dominated by Chinese firms, Indian and Brazilian companies ranked joint second (eight companies each) among emerging economies after China (73). Despite the remarkable rise of transnational corporations (TNCs) from India over the past decade, there was, until last year, no systematic attempt to rank Indian TNCs using any globally accepted measure. The Indian School of Business, in collaboration with Fundação Dom Cabral (FDC), a leading business school in Brazil, published, for the first time in 2012, a ranking of India’s most internationalised companies. This ranking, based on a globally accepted and widely used measure known as the Transnationality Index (TNI), allowed for a proper comparison of Indian TNCs with each other and with other global players.
In this article, we describe the highlights of the current year’s (2013) ranking survey, which improves upon last year’s in at least three ways. First, we have expanded participation by including several other companies in our list. Second, we gained insights into the nature of these companies’ internationalisation by noting their geographical spread. Third, through this survey, we improved our understanding of one of the key drivers of Indian companies’ internationalisation process, namely cross-border acquisitions.
Outward Foreign Direct Investments from India
After rising consecutively for two years from the lows of global financial crisis levels, global outward foreign direct investments (OFDI) dipped again in 2012. The aggregate global FDI outflows had increased to US$14.5 trillion in 2010 (an increase of 31% over 2009) and then to US$16.2 trillion in 2011 (an increase of 12% over 2010). However, 2012 again saw global OFDI dip 12% to US$14.2 billion. The aggregate OFDI trends from India were similar to global trends. Financial year (FY) 2012 saw a sharp drop in overseas investments by Indian companies (Figure 1). OFDI fell 34% from US$16.8 billion in 2010-11 to US$11.1 billion in 2011-12. But as this article will show, India’s most internationalised companies continued their aggressive expansion, with their reign sales, assets and employment growing significantly faster than other companies. The group of 25 companies featured in our ranking collectively increased their foreign revenues by 26%, foreign assets by 22% and foreign employee count by 15% – no small feat considering that FY2012 was not a good year for the overall investment climate.
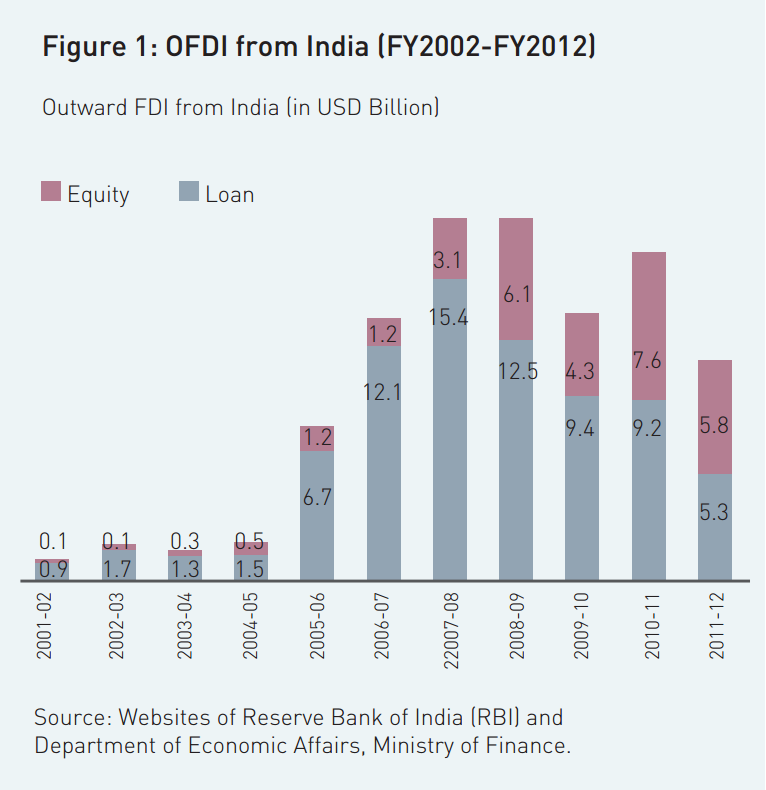
Indian companies are globalizing into newer geographies. Until around 2000, the key thrust for overseas expansion was to enter mostly developing countries with low technology competition. However, investment trends suggest that over the last decade, overseas investments have been flowing towards developed countries as well (Table 1). Indian companies seem to be driven by the need to have access not only to the lucrative consumer markets of developed countries for their products but also to highly sophisticated technologies and knowledge assets.
Survey of Indian Transnational Companies
The ranking methodology is based on the framework (TNI) developed by the United Nations Conference on Trade and Development (UNCTAD). This standardised index can be used for comparative analysis with similar surveys conducted in countries other than India. The UNCTAD index uses a combination of three measures to determine the degree of internationalisation of companies:
- Percentage of International Assets – Consolidated International Assets/ Consolidated Total Assets
- Percentage of International Revenues – Consolidated International Revenues/ Consolidated Total Revenues
- Percentage of Foreign Employees – Total Number of Foreign Employees/ Total Number of Employees
The average of these three measures reflects the TNI of the firm. The multidimensionality of the index accounts for the variation in the three indicators across industries. For example, the services sector would have a larger proportion of international employees but a smaller proportion of international assets – the antithesis of manufacturing firms.
In India, it is not possible to calculate the TNI and rank companies using it, with secondary data alone, as some of the data required to calculate TNI is not publicly disclosed by firms. For example, the number of international employees or foreign assets cannot be obtained from public sources for all firms. Thus, our study incorporates a mix of primary and secondary research to arrive at the rankings.
Secondary Research
We used secondary data from Prowess, a publicly available database maintained by the Centre for Monitoring Indian Economy (CMIE). Prowess includes information sourced from the financial reports of companies in India from 1989 onwards. We excluded all banking and financial services companies from our study, as their financial assets are often not comparable with the assets of other sectors such as manufacturing and non-financial services. The “Investment outside India”1 indicator in Prowess helped us identify a set of 5002 potential firms for the study. This indicator, however, only lists non- consolidated data; therefore, we needed to vet actual consolidated assets through other secondary sources. We used Standard & Poor’s Capital IQ database to track consolidated overseas assets and consolidated overseas revenues. We also referred to the annual reports of publicly listed companies to track these indicators. Thus, we eliminated firms which had a minimal presence outside India (in terms of assets). We then shortlisted 50 companies with high proportions of international revenues and international assets to contact for further information.
Indian companies are globalising into newer geographies. Until around 2000, the key thrust for overseas expansion was to enter mostly developing countries with low technology competition. However, investment trends suggest that over the last decade, overseas investments have been flowing towards developed countries as well.
Primary Research
We prepared two sets of questionnaires for the 50 companies on our list. The first, and shorter, questionnaire focused on the firm’s international activities. The firms were asked to provide us with ratios of international revenues, assets and employees to total revenues, assets and employees respectively. They were also asked to provide the regional breakup (split into North America, Europe and others) of their international revenues, assets and employees.
We then contacted the senior leadership of the 50 companies and asked them to respond to our questionnaire. Of the 50 companies we contacted, 28 companies responded to our questionnaire. We expect the response rate to improve over the next few years as companies become more familiar with the survey and with the concept of TNI. We validated the data collected through primary research using secondary data and created a composite TNI ranking based on the available data.
Ranking Results and Analysis
Based on the responses received, we were able to rank 27 companies3. We were not able to rank Tech Mahindra and Wipro (though we believe these companies to be highly internationalised) because these companies were unable to provide us with a split of their foreign and domestic assets. We divided the 27 companies into two separate ranking lists in order to distinguish them on the basis of their asset size. The first list ranked those companies with international assets of at least US$500 million in FY 2012, while the second list ranked the remaining companies. Table 2 lists the top 15 TNCs with international assets greater than US$500 million while Table 3 lists the top 10 TNCs with international assets of less than US$500 million.
In the current year’s rankings, the state-owned company ONGC Videsh has displaced Tata Steel as India’s most internationalised large company. Calling itself the “international petroleum company of India,” ONGC Videsh’s primary motive is to “prospect for oil and gas acreages abroad, which includes acquisition of oil and gas fields in foreign countries as well as exploration, production, transportation and sale of oil and gas4.” However, although ONGC Videsh operates as a separate company, it is still a wholly owned subsidiary of ONGC Limited. If we were to rank its parent company ONGC Ltd. separately, its TNI index would be about 12%; therefore, it would not feature in the above list as one of the top internationalised companies Motherson Sumi Systems saw the highest jump in rankings (from 11 in FY2011 to 4 in FY2012). This was primarily due to Motherson’s acquisition of an 80% stake in German auto component manufacturer Peguform in July 2011. Peguform, with 2010 sales of Euro 1.37 billion, was as large a company in terms of revenue and assets as Motherson Sumi Systems during the time of its acquisition. In fact, this phenomenon of Indian companies expanding aggressively through the acquisition of large overseas companies is not new. Many companies that feature in the above list (Table 2) have in fact expanded through the acquisition of overseas entities of comparable size. Examples include Tata Steel-Corus, Tata Tea-Tetley, Hindalco-Novelis and Tata Motors-JLR.
The Top 10 companies in Table 2 have a TNI of more than 50%, which is comparable to that of the top transnational corporations from the developed countries. The majority of the companies on our list are affiliated to business groups – a phenomenon unique to emerging economies – with companies from the Tata group dominating the list. A key driver of the Tata group companies’ dominance could be the former Chairman of the Tata group, Ratan Tata’s global vision and ambitions for the group companies.
Table 3 lists India’s most internationalised companies with an international asset base of less than US$500 million. These companies, though relatively small, have not shied away from initiating aggressive international expansion activities. Consider Core Education & Technologies Limited, a global education company founded in 2003 by Sanjeev Mansrota. Today, a decade after it began operations, Core has a presence in 14 countries, earns more than 95% of its revenue from international operations and has more than 70% of its assets located abroad. Like its bigger counterparts, Core Education has primarily grown through international acquisitions, having acquired seven foreign companies in the last seven years.
Tracking the Growth
The top 15 TNCs with assets of US$500 million or more earned 75% of their total revenues from international operations, held 57% of their total assets overseas, and employed 20% of their total workforce abroad (Table 4). The top 10 smaller TNCs, with international assets of less than US$500 million, were less internationalised than their larger counterparts, earning 61% of their total revenues from international operations, holding 28% of their total assets abroad and employing 20% of their employees in overseas operations (Table 5).
How Diverse is the TNCs’ Internationalisation?
Our analysis suggests that India’s top TNCs have a balanced presence in both developed and developing markets. This finding is in line with some of the recent international business literature, which asserts that emerging market multinational companies do not necessarily have a preference for expanding into the culturally closer and low technology markets of developing countries. These emerging market multinationals tend to internationalise faster and prefer higher risk entry modes such as acquisitions.
They follow unconventional internationalisation paths, sometimes preferring to expand first into developed markets rather than into other developing economies. They display risk-taking behaviour and do not hesitate to make large investments and resource commitments even in the initial phases of their international expansion. The top 15 Indian TNCs (with international assets >= US$500 million) on an average earned 63% of their international revenues from the developed markets of North America and Europe, held 50% of their total assets abroad and employed 50% of their international employees in these markets in 2011-12 (Table 6).
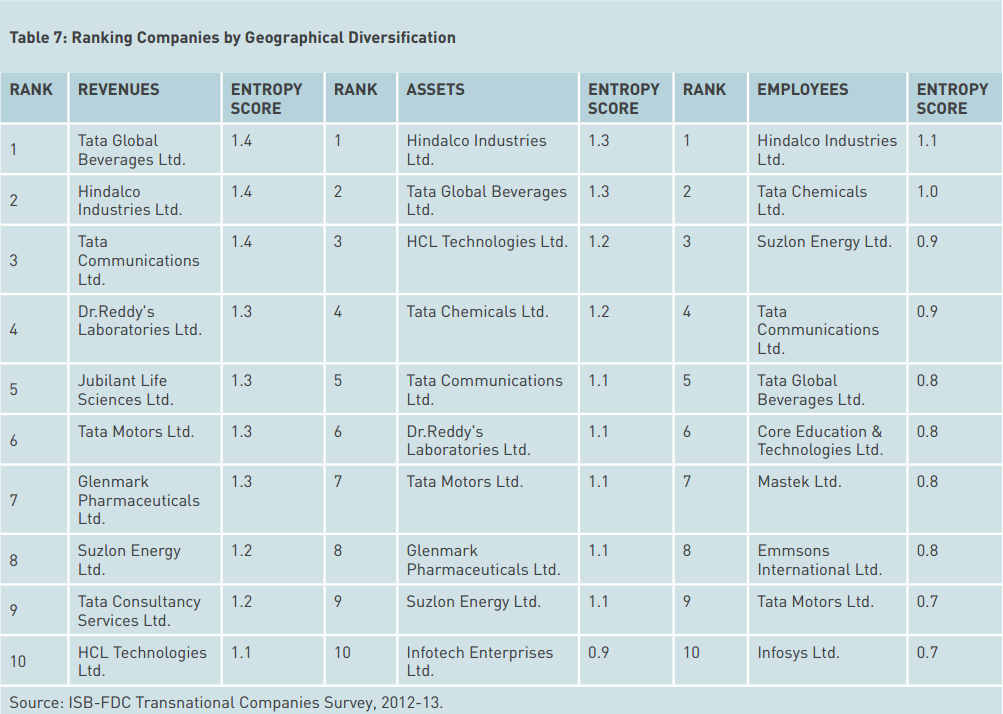
The survey data also enables us to calculate and rank the Indian TNCs based on their geographic diversity, i.e., how diversified their international operations are. A highly geographically diversified company (say in terms of revenues) earns its revenue from multiple geographical regions of the world, and is therefore better able to spread its revenue risk by not being overly dependent on any single geographical market. A less diversified company will have its revenue concentrated in one or two geographical regions. A widely used measure of diversification by academicians is a Herfindahl-type quantitative index or entropy measure5 . The higher the entropy score, the more diversified a company is. We calculated separate entropy scores for revenues, assets and employees. Based on the entropy scores (Table 7), we see that Tata Global Beverages is the most geographically diversified company in terms of revenues, while Hindalco Industries is the most diversified in terms of assets and employees6.
While the proportion of international assets and revenues of top Indian TNCs is somewhat comparable to that of top global TNCs, Indian companies lag behind significantly when it comes to employing a global workforce.
Comparison of Indian TNCs with Top TNCs Globally
The obvious next question to ask is: how do India’s top TNCs fare when compared with the world’s largest TNCs? Our survey can help provide an answer because we use the same measure to calculate TNI as UNCTAD uses to rank the world’s 100 largest non- financial TNCs7. The world’s top 100 non-financial TNCs earned 83% of their revenues, owned 79% of their assets and employed 61% of their employees outside of their home country in 2011. The average TNI score of 74% for these top 100 TNCs is higher than the TNI score of all the Indian TNCs ranked in our list except for ONGC Videsh. While the proportion of international assets and revenues of top Indian TNCs is somewhat comparable to that of top global TNCs, Indian companies lag behind significantly when it comes to employing a global workforce. We expect this gap to reduce gradually as India becomes more integrated with the rest of the world and when top Indian companies emerge as truly global. Table 8 provides a list of top global non- financial TNCs ranked by foreign assets.
Comparison with Top 15 Brazilian TNCs
Critics might observe that comparing the degree of internationalisation of top Indian companies against that of the top global TNCs might not be very relevant given the two groups’ different globalisation starting points. While many of the world’s top 100 TNCs started their internationalisation journey several decades ago, the internationalisation initiatives of Indian companies are a more recent phenomenon. However, it may be appropriate and interesting to compare the degree of internationalisation (as measured in TNI %) of the top Indian TNCs with that of the top TNCs of another country with a similar level of economic development as India. FDC, our partner in this study, has published a list of top Brazilian TNCs for several years. FDC also employs the same measure (TNI) to define its rankings. According to FDC’s survey, the average transnational index for the top 15 Brazilian companies was 37% in 2011 compared to 53% for the top 15 Indian TNCs with international assets of at least US$500 million (Table 9).
This shows that Indian TNCs are in general more internationalised than their Brazilian counterparts. This difference may be due to the fact that many of the Indian companies in our list have carried out large overseas acquisitions, while Brazilian companies have used more gradual and diverse entry modes, such as commercial offices, joint ventures and partnerships. Given that cross-border acquisitions have played such a significant part in the internationalisation journey of Indian multinationals, we included a special section in our survey focusing on acquisitions, the highlights of which are described in a separate article in this issue.
Conclusion
Despite the general dip in aggregate overseas FDI in 2012 (both for global and India), top Indian TNCs continued their aggressive globalisation march by showing double digit growth in international revenue, assets and employees. We anticipate that the extent of globalisation will only increase further as India becomes more integrated with the rest of the global economy and as Indian companies gain more confidence by acquiring experience in overseas markets.
Our study is the first, and possibly still the only, systematic attempt to rank Indian TNCs based on the TNI. We improved on last year’s survey by expanding our list of covered companies, and also by gaining insights into the countries of destination of internationalisation. We were also able to objectively compare how the top Indian TNCs fared in their globalisation efforts when compared with the top 100 global TNCs and also with the top 15 Brazilian TNCs. We also gained insights into key overseas acquisition related issues facing leading Indian TNCs, such as acquisition motivations, integration mechanisms and post-acquisition performance. In our future reports, we plan to continue studying other key drivers of internationalisation of Indian TNCs.
Notes
1 The ‘Investments outside India’ field captures the total value of cumulative investments made by the company outside India. The overseas investments could be in equity shares, preference shares, debt instruments, mutual funds, or other investments such as in immovable properties, capital of partnership firms, etc. They could be for long-term or short-term purposes.
2 The top 500 companies with the largest ‘Investments outside India’were chosen as the initial list.
3 However, only the top 25 companies are listed in this report.
4 Source: Company’s website
5 The Herfindahl or entropy measure of diversification of revenues weights the proportion of revenues from a particular region (p) by the logarithm of (1/p) and then sums the resultant for all regions to get the score. For example, a hypothetical company that earns its revenue from one single region will have an entropy score of zero while another company that earns its revenue in equal proportion from four different world regions will have an entropy score of about 1.4.
6 All three entropy scores for Motherson Sumi Systems and Bajaj Auto Ltd and two scores for Tata Steel (assets and employees entropy scores) could not be calculated due to the absence of geographical split information.
7 Ranking table can be accessed at www.unctad.org/Sections/dite_dir/docs/WIR12_webtab28.xls