India’s urban population is currently around 377 million and is projected to reach about 820 million by 2050. Though urban India constitutes only about 31% of the country’s total population, it contributes over 60% of its GDP and is projected to account for nearly 75% of the GDP in the next 15 years. This is in line with the experience in most parts of the World, where urbanisation has accompanied economic development. It is for this reason that cities are referred to as the “engines of economic growth”. And ensuring that they function as efficient engines will becritical for our national development.
A 31% share of the urban population places us well below the global average of 50%. This relatively low base allows us to plan our urbanisation strategy in the right direction by adopting resource efficient policies and also taking advantage of the latest developments in technology. It allows us an opportunity to learn from good practices as well as mistakes made elsewhere.
Unfortunately, there is a huge backlog in the infrastructure requirements in our cities and much needs to be done. Most cities suffer from inadequate electricity and water. Housing is insufficient, especially to meet the needs of the poor, and management of solid waste is weak. Most cities suffer from poor transport systems resulting in severe congestion and long travel times. These backlogs, coupled with the projections of a rapid increase in the urban population present a daunting challenge for our leaders – a challenge that has to be dealt with urgently if our efforts at economic development are to succeed. Therefore, the Government’s initiative for the “100 Smart Cities”, seen in the backdrop of these shortcomings may appear critical for development.
Building our cities to world standards calls for huge finances. The moot point however is, where do we find the resources? While the expectation is that a significant part of it would come from the public budget, current revenue accruals seem grossly inadequate for the investments required. This paper looks at possible options for raising additional revenues and presents examples from other parts of the world on innovative ways of financing. Thereafter, it presents a simple assessment of the amounts that can possibly be raised from some of these sources in the context of financing the transport systems in Delhi. It also analyses the potential saving in capital costs if policies that encourage compact city development are adopted.
The specific case of financing transport needs in Delhi has been used for this analysis as:
- transport is projected to require a very high share of the investment, and
- analysis of a specific case allows a deep dive and presents lessons that can be replicated.
Investment needs
Two recent publications give an indication of the magnitude of the funds required to build the required infrastructure in our cities. A High Power Expert Committee (HPEC) on Urban Infrastructure, set up by the Ministry of Urban Development, has estimated that ` 39.2 lakh crores would be required over the next 20 years. A publication by McKinsey, titled “India’s Urban Awakening” has estimated a requirement of ` 54 lakh crores ($1.2 trillion) between 2010 and 2030. Further the HPEC also estimates that about 74% of this will be required for transport related infrastructure (55.8% for urban roads, 14.5% for urban transport-primarily mass transport, 3.2% for traffic support infrastructure and 0.6% for street-lighting). The McKinsey report estimates transport’s share at about 49% of the overall investment. The differences in estimates could be attributed to the fact that the HPEC has only covered eight sectors (water supply, sewerage, solid waste management, storm water drains urban roads, urban transport, traffic support infrastructure and street lighting) whereas the McKinsey report has gone beyond by covering affordable housing as well. A rough estimate of the transport related investments for Delhi, in the next 20 years, based on the two reports, is calculated in Table 1. Obviously the differences in estimates are significant. However, going into the possible reasons for these differences is not within the scope of this work and so, as a measure of abundant caution , this paper takes the higher of the two figures as the likely investment needed in transport in Delhi over the next 20 years – ` 238,140 crores.
Lessons from other parts of the world
Four major mechanisms have been used successfully in other parts of the world to finance investments in transport, each with a rationale of its own. First, a brief description of each of these.
A 31% share of the urban population places us well below the global average of 50%. This relatively low base allows us to plan our urbanisation strategy in the right direction by adopting resource efficient policies and also taking advantage of the latest developments in technology. It allows us an opportunity to learn from good practices, as well as mistakes made elsewhere.
Transport Tax
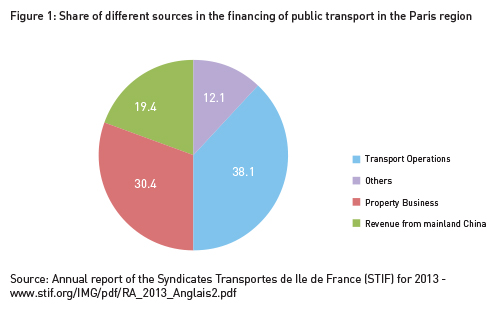
French cities use a tax known as versement transport (Transport Tax) as an important source for financing public transport relating investments. Every company employing more than a certain number of people is required to pay a percentage of its wage bill as transport tax. The rationale has been that employers are indirect beneficiaries of public transport system as it helps them secure the required labour for their commercial activities and so should contribute to the investment. In the Paris region this is capped at 2.7% of the wage bill. This yielded an average of around €3000 million per year during 2007 – 2011 and constituted around 35% of the total requirements, with another 35% coming from fare revenues on public transport systems. Figure 1 gives the breakup of the different sources of revenue for public transport in the Paris region in 2013. This shows that the Transport Tax has been the most important source for financing public transport systems in this region.
Gasoline Tax
A fuel tax (also known as gasoline or gas tax) is imposed on the sale of fuel in several countries. In the United States, for instance, this is levied both by the State and the Federal Governments. The federal tax is levied at 18.4 cents per gallon on petrol and 24.4 cents per gallon on diesel. The state tax varies from state to state. The federal tax alone yielded $ 27 billion in 2009 and the State and Local taxes came to $41.5 billion. Therefore, the gasoline tax is a significant source of funds for the transport sector in the US. While a large part of it goes towards the maintenance of the road network, increasing shares from this have been allocated for funding mass transit.
The property owners close to a newly constructed infrastructure, who benefit from an increase in their property value, would have to contribute some of the benefits they derive from the public investment for financing the investment itself. Land Value Capture (LVC) is a strategy that several cities have adopted to raise resources, especially for investments in transport infrastructure. It seeks to capture, for the community at large, some of the benefits that accrue to land owners from land value increments generated on account of public investments in infrastructure.
Land Value Capture
Land Value Capture (LVC) is another strategy that several cities have adopted to raise resources, especially for investments in transport infrastructure. It seeks to capture, for the community at large, some of the benefits that accrue to land owners from land value increments generated on account of public investments in infrastructure. Thus, property owners close to a newly constructed metro station, who benefit from an increase in their property value, would have to contribute some of the benefits they derive from the public investment for financing the infrastructure project (metro station, here) itself. For example, property owners close to a newly constructed metro system also stand to benefit, even if they do not use the metro system, as the value of their property goes up considerably. Hence, some part of this increased value should be ploughed back to finance the related investment. This is one form of LVC that is more popularly known as “Betterment Levy”.
Another form of Land Value Capture is to use the air rights above the newly created facilities for commercial exploitation. Transport systems generally use only the land at the ground level or, at best, one/two floors above and below. However, the “air rights” above this land can be commercially exploited to pay for the investment. Such commercial exploitation can happen by way of building new property – generally residential of commercial property – and either selling it or renting it out. Another alternative is to allow a higher “Floor Area Ratio” (FAR) for properties located close to mass transit stations and charge for such additional rights. Apart from yielding additional finances, it allows higher densities close to the mass transit stations and thereby enhances the attractiveness of the system, implying higher ridership and higher revenues.
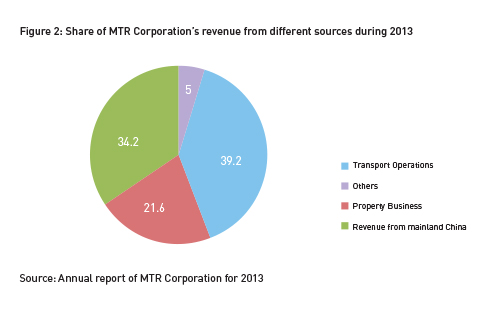
As an example, the MTR Corporation of Hong Kong, which owns and operates the metro system in the city, earned HK$8.4 billion from its property business in 2013. This constituted 21.6% of its total earnings during the year. Figure 2 shows its share of earnings from different sources during 2013.
Additional Vehicle Registration Fee in Singapore
Singapore uses an elaborate set of measures to discourage the ownership of motor vehicles. It requires that a Certificate of Entitlement (CoE) be obtained in an auction before one is allowed to buy a car. While registering the car, there is a registration fee
of S$1000, but there is also an additional registration fee that is a percentage of the open market value of the car. In the budget for 2013, this additional registration went up to 100% on the first to fetch S$20,000, 140% on the next to S$ 30,000 and then it went up by 180% to S$50,000. Thus, it amounts to more than the cost of the car. When the cost of the Certificate of Entitlement is also added, the cost of owning a car becomes very steep in Singapore. This is the strategy used to discourage car ownership.
Options for financing Transport Investments in Delhi
In this section, rough estimates of the possible amounts that can be raised through different financing options have been presented. The following options have been analysed:
1 Property development with higher Floor Area Ratio (FAR) at the metro rail stations
2 Additional fuel tax
3 Increased vehicle registration fees
4 Transport tax
The potential for savings in capital investment through increased densification (and reduced sprawl) are also examined
Another form of Land Value Capture is to use the air rights above the newly created facilities for commercial exploitation. Transport systems generally use only the land at the ground level or at best, one/two floors above and below. However, the air rights above this land can be commercially exploited to pay for the investment. The “air rights” over each station, along with adjacent areas, are excellent candidates for densification and property development.
Property Development at Metro Rail Stations with additional FAR
When completed, the metro rail system in Delhi is expected to have a total length of 440 kms which will be covered in four phases. Two phases are already complete and the third is under implementation. Phase 4 is yet to be approved, but going by past experience and the positive reactions to the metro system, there is little doubt that this will also get approved. The total network will have 330 stations.
The “air rights” over each station, along with adjacent areas, are excellent prospects for densification and property development. In estimating the likely revenues from this, the following assumptions have been made:
- an area falling within a radius of 200 meters is taken up for intense development
- additional FAR of 6 is granted (this is high compared to the FAR of 1.5 – 2.0 in most parts of Delhi. However, it is very modest by the standards followed in many large cities around the world – Singapore allows an FAR of 21)
- only 50% of the land area is available as the rest is used up for roads and other public utility needs
- residential and commercial property is developed by the metro rail agency (the Delhi Metro Rail Corporation in this case) at an average cost of ` 20,000 per sq metre
- the average sale value is ` 100,000 per sq metre (taken as an approximate average of property values in different parts of Delhi from www.magicbricks.com)
- the Delhi Metro Rail Corporation gets the land free of cost (or at a marginal lease fee)
- only half the property built is sold out and the remaining half is rented. The proceeds from the sale are used towards the capital cost and the rental income contributes to the operating deficits.
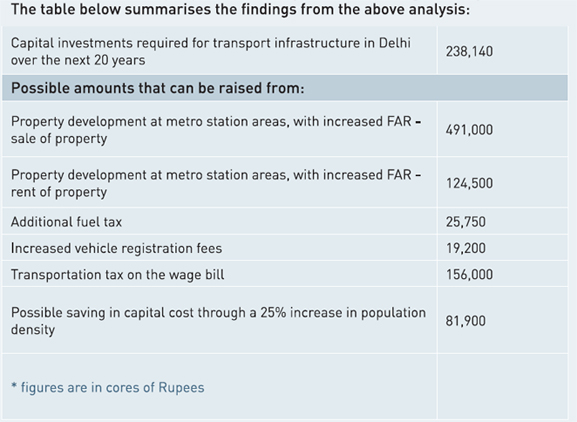
Calculations show that an amount of ` 491,000 crores can be raised from sale of the property and an amount of ` 124,500 crores can be raised from rental income over 20 years, presuming a 3% annual increase in the rents.
The total employment in Delhi, as per the Economic Survey of the City in 2001 was 4.5 million. Many of them are employed in the informal sector and it will be difficult to collect a percentage of the wage bill from such informal employees. We presume that only 50% of those employed are regular and salaried employees and they are mostly in the middle and higher income range. We assume an average annual salary of ` 100000 per person and 3% of the wage bill can be levied as the Transport Tax. This would yield an income of ` 156000 crores over 20 years.
Fuel Tax
During 2013-14, 797,000 metric tonnes of petrol and 1,129,000 metric tonnes of diesel were sold in Delhi. This translates into 1080.7 million litres of petrol and 1275.8 million litres of diesel. If a tax of 10% is levied on the current prices of petrol and diesel (` 60/litre for petrol and ` 50/litre on diesel) an amount of ` 25,750 crores can be raised in 20 years. The same tax on petrol alone would yield ` 13,000 crores in 20 years.
Increased Vehicle Registration Fee
The number of new cars and motor bikes registered in Delhi during 2012-13 was 172,727 and 301,259 respectively. For estimating the likely revenues from increased vehicle registration fees, the following assumptions are made:
- the same number of vehicles will be registered each year for the next 20 years
- the weighted average cost of the vehicles is` 200,000
- an additional registration tax of 10% of levied on each new vehicle registered.
Based on these assumptions, it is seen that an amount of ` 19,200 crores can be raised over the next 20 years.
Transport Tax
The total employment in Delhi, as per the Economic Survey of the City in 2001 was 4.5 million. This showed a decennial increase of 51.9% in the work force between 1991 and 2001. If the same increase were to be presumed for each of the next 2 decades, the average employment each year, over the next 20 years, would be 6.5 million persons.
Many of them are employed in the informal sector and it will be difficult to collect a percentage of the wage bill from such informal employees. We presume that only 50% of those employed are regular and salaried employees and they are mostly in the middle and higher income range. We assume an average annual salary of ` 100,000 per person and 3% of the wage bill as the Transport Tax. This would yield an income of ` 156,000 crores over next 20 years.
Possible Savings Through Compact City Development
As the urban population grows, cities also tend to grow in size. This is a global phenomenon (Angel, 2011). However, with special measures it is possible to curb this sprawl and enable cities to grow in a more compact manner. Compact development allows the city to be served by smaller transport, water supply, drainage and sewerage disposal networks. This would help reduce the capital investments needed in building the required infrastructure.
In order to the assess the savings that are possible through compact growth policies in Delhi, an an assessment of the potential savings from densification was carried out. Calculations show that a 25% increase in density will help reduce the capital cost by ` 108,780 crores.
Savings in the capital cost of mass transit systems with an increase in density
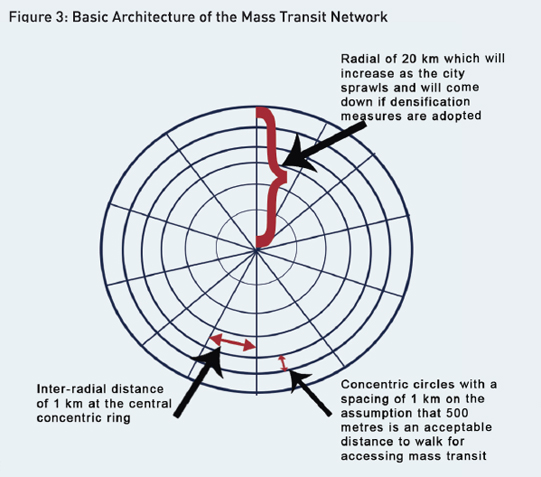
With a population of 17 million and an area of approximately 1600 sq kms, Delhi has a population density of 10625 persons/sq km. It is roughly circular in shape with concentric rings and radial roads as the backbone of its transport network. It is generally accepted that mass transit systems are attractive if they can be accessed within a walking distance of 500 metres. If people have to walk for more than 500 metres then they prefer to use their personal motor vehicles.
If we use this principle to design a mass transit network for Delhi, it would be necessary to have one that has a length of 2577 kms (see figure 3 for the basic architecture of the network). In the next 20 years, the population of Delhi will go up from 17 million to 28 million if we assume that the current growth trends of 2.5% per year continue. This will mean that the area will go up from 1600 sq kms to 2635 sq kms if current densities are maintained (in actual practice densities are decreasing as people seek bigger houses and find personal transport increasingly affordable). This will mean that the radius will go up to 29 kms and the city will need a mass transport network of 5016 kms. However, if policies that encourage a 25% increase in density are adopted, the additional population can be accommodated within an area of 2108 sq kms – i.e. a radius of 26 kms. This reduces the size of the network to 4007 kms – a reduction of 1008 kms.
A willingness to take mass transit if accessible within 500 metres is assumed here. Therefore, distance between two mass transit lines to be i km so that the average distance is 500 metres. This means, the distance between the radials has to be 1 km at the middle concentric ring – ie – radials of 20 kms each. Also distance between concentric rings to be 1 km, implying 20 concentric rings.
Total length of network = No. of rings * circumference of each ring + No. of radials * length of each radial
At current prices, a rough estimate of the cost of an elevated metro rail system is ` 250 crores/km and of a Bus Rapid Transit system in ` 25 crores/km. We presume a network composition with 25% as metro rail and 75% as bus rapid transit. This means the weighted average cost of a mass transit system is ` 81.25 crores/km. So a reduction in the length of the mass transit network by 1008 kms means a saving of ` 81,900 crores.
Conclusion
Thus, although the investments in urban infrastructure are going to be huge, it is possible to raise these funds through innovative financing. In particular, the land resources of a city offer attractive opportunities for raising large amounts. The calculations in this paper have only assumed that property development, with increased FAR, would happen only around metro stations. This by itself, is enough to fund the entire transport infrastructure required in the city and more. There is potential for such development in many other parts of the city, such as the Railway stations, the inter-state bus terminals, major commercial centers, etc. These would enhance the potential immensely.
Apart from this, there are other justifiable sources, but a choice may have to be made based on the ease of collection and larger policy considerations of the Government of the day. The fact remains that financial resources will not be a constraint to building urban India if there is a willingness to look at innovative ways of financing it as well as adopting policies that discourage sprawl.
Footnotes
1 McKinsey has given their estimates in US$ and seems to have used an exchange rate of 1$ = Rs 45. The HPEC’s report used only Indian Rupees. For consistency, this paper only uses Indian Rs in the calculations.
2 Used the 2011 census figure and assumed a 2.5% growth per year
3 Used the figure given for large cities in para 3.3.9 of the report
4 Used figure given in exhibit 10 with 1$=Rs 45 as the exchange rate which seems to be the rate used in the report as evident from the numbers in the 2nd para of page 23
References
Angel, Shlomo. 2011.Making Room for a Planet of Cities. Lincoln Institute of Land Policy.
Cervero, Robert,The transit metropolis : a global inquiry. (Island Press, Washington, D.C., 1998)
Cervero, Robert, and Jin Murakami, “Rail and Property Development in Hong Kong: Experiences and Extensions,”Urban Studies 46(2009):2019–2043.
Govt. of India, 2011, Report on Urban Infrastructure and Services, High Power Expert Committee
McKinsey Global Institute, 2010, India’s Urban Awakening: Building Inclusive Cities, Sustaining Economic Growth
Murakami, Jin. “Transit Value Capture: New Town Codevelopment Models and Land Market Updates in Tokyo and Hong Kong.”in Value Capture and Land Policies, ed. G. Ingram and Y.H. Hong. (Cambridge, MA: Lincoln Institute of Land Policy, 2012). Suzuki, Hiroaki, Cervero, Robert, and Kanako Iuchi.Transforming Cities with Transit, Washington, D.C.: World Bank, 2013.
UN-Habitat (United Nations Human Settlements Program), 2003.The Challenge of the Slums: Global Report on Human Settlements 2003, London: Earthscan Publication, 2003.
UN-Habitat (United Nations Human Settlements Program). 2008. The State of the World’s Cities 2008/2009:Harmonious Cities, London: Earthscan Publication.
UN-Habitat (United Nations Human Settlements Program), The State of the World’s Cities 2012/2013: Prosperity of Cities, New York, NY: Routledge, 2013.
World Bank. “The World Bank Urban and Local Government Strategy, Washington DC: World BANK, 2009.


